Environmental Management Policies
In light of global climate change, the increasing difficulty in obtaining natural resources, and the continuous development and expansion of industries, resource utilization and environmental pollution have become globally significant issues. To ensure the sustainable operation and development of the industry, Chung Hwa Chemical is committed to the effective utilization of natural resources and the control of pollutant emissions. In addition to strictly adhering to environmental protection laws and regulations to meet legal compliance requirements, the company actively seeks technological resources to address the critical challenge of reducing pollutant output.
Chung Hwa’s Environmental Protection Policy
〝"Maintain the natural landscape, improve pollution prevention and control technology, strive to reduce waste and reuse resources, and reduce the greenhouse effect."In order to fulfill the company's social responsibilities and commitments and the goal of sustainable management, the company adheres to:"Maintain the natural landscape, improve pollution prevention and control technology, strive to reduce waste and reuse resources, and reduce the greenhouse effect."are jointly working to promote the environmental management system.
Water and Effluents
As major products require a large amount of water,
Chung Hwa is well aware that water is an important issue in product manufacturing.
In addition to continuously integrating product water consumption monitoring to rationalize water consumption, we continue to implement water reuse measures and promote various water-saving plans.
In addition, during the energy-saving meeting, measures and management aspects were reviewed and improved in response to water-saving goals.
Chung Hwa’s water resource management policy:
- Promote water conservation to reduce water consumption per unit of output.
- Implement water conservation and recycling in the process to significantly reduce water consumption.
- Gradually implement the water regeneration plan.
- Encourage all units to pay attention to water resource risks and make joint efforts for water conservation.
- Promote water inventory, water conservation, establish water footprint, and set water conservation goals.
Site-Wise Water Consumption
| Site | Items | Unit | 2022 | 2023 | 2024 |
|---|---|---|---|---|---|
| Taoyuan Plant No. 1 | Top Water | Million Liters | 377.913 | 373.353 | 349.006 |
| Water Discharge | Million Liters | 168.044 | 159.103 | 145.450 | |
| Water Consumption | Million Liters | 209.869 | 214.250 | 203.556 | |
| Taoyuan Plant No. 2 | Top Water | Million Liters | 1.164 | 0.987 | 1.790 |
| Water Discharge | Million Liters | 0.903 | 0.721 | 1.431 | |
| Water Consumption | Million Liters | 0.261 | 0.266 | 0.359 | |
| Changhua Plant | Top Water | Million Liters | 0.019 | 0.020 | 0.029 |
| Water Discharge | Million Liters | 0 | 0 | 0 | |
| Water Consumption | Million Liters | 0.019 | 0.020 | 0.029 |
(The scope of the data includes all operational and office areas across all sites.)
Air Pollution Control
Chung Hwa continues to control the normal operation of each air pollution prevention and control equipment, and conducts regular testing in accordance with legal requirements to confirm that pollutant emissions are in compliance with specifications, and uses the testing results as a basis for improvement and review of processes and pollution prevention and control equipment. For the volatile organic solvent production line, we updated the process and increased the organic solvent recovery rate, and reviewed and inspected each valve component so that the emissions of volatile organic compounds (VOCs) can be continuously reduced. In order to reduce air pollutant emissions, the starting fuel for the sulfur furnace was changed from diesel to natural gas to reduce air pollutant emissions.
Waste Management
In accordance with the Waste Disposal Act, waste is collected, stored, sorted, and processed to achieve the most complete waste classification. Each unit centralizes waste in the storage area, and the responsible unit manages waste to effectively grasp the source of waste. We also cooperate with resource recycling companies to increase the value of resource utilization, with the ultimate goal of zero waste.
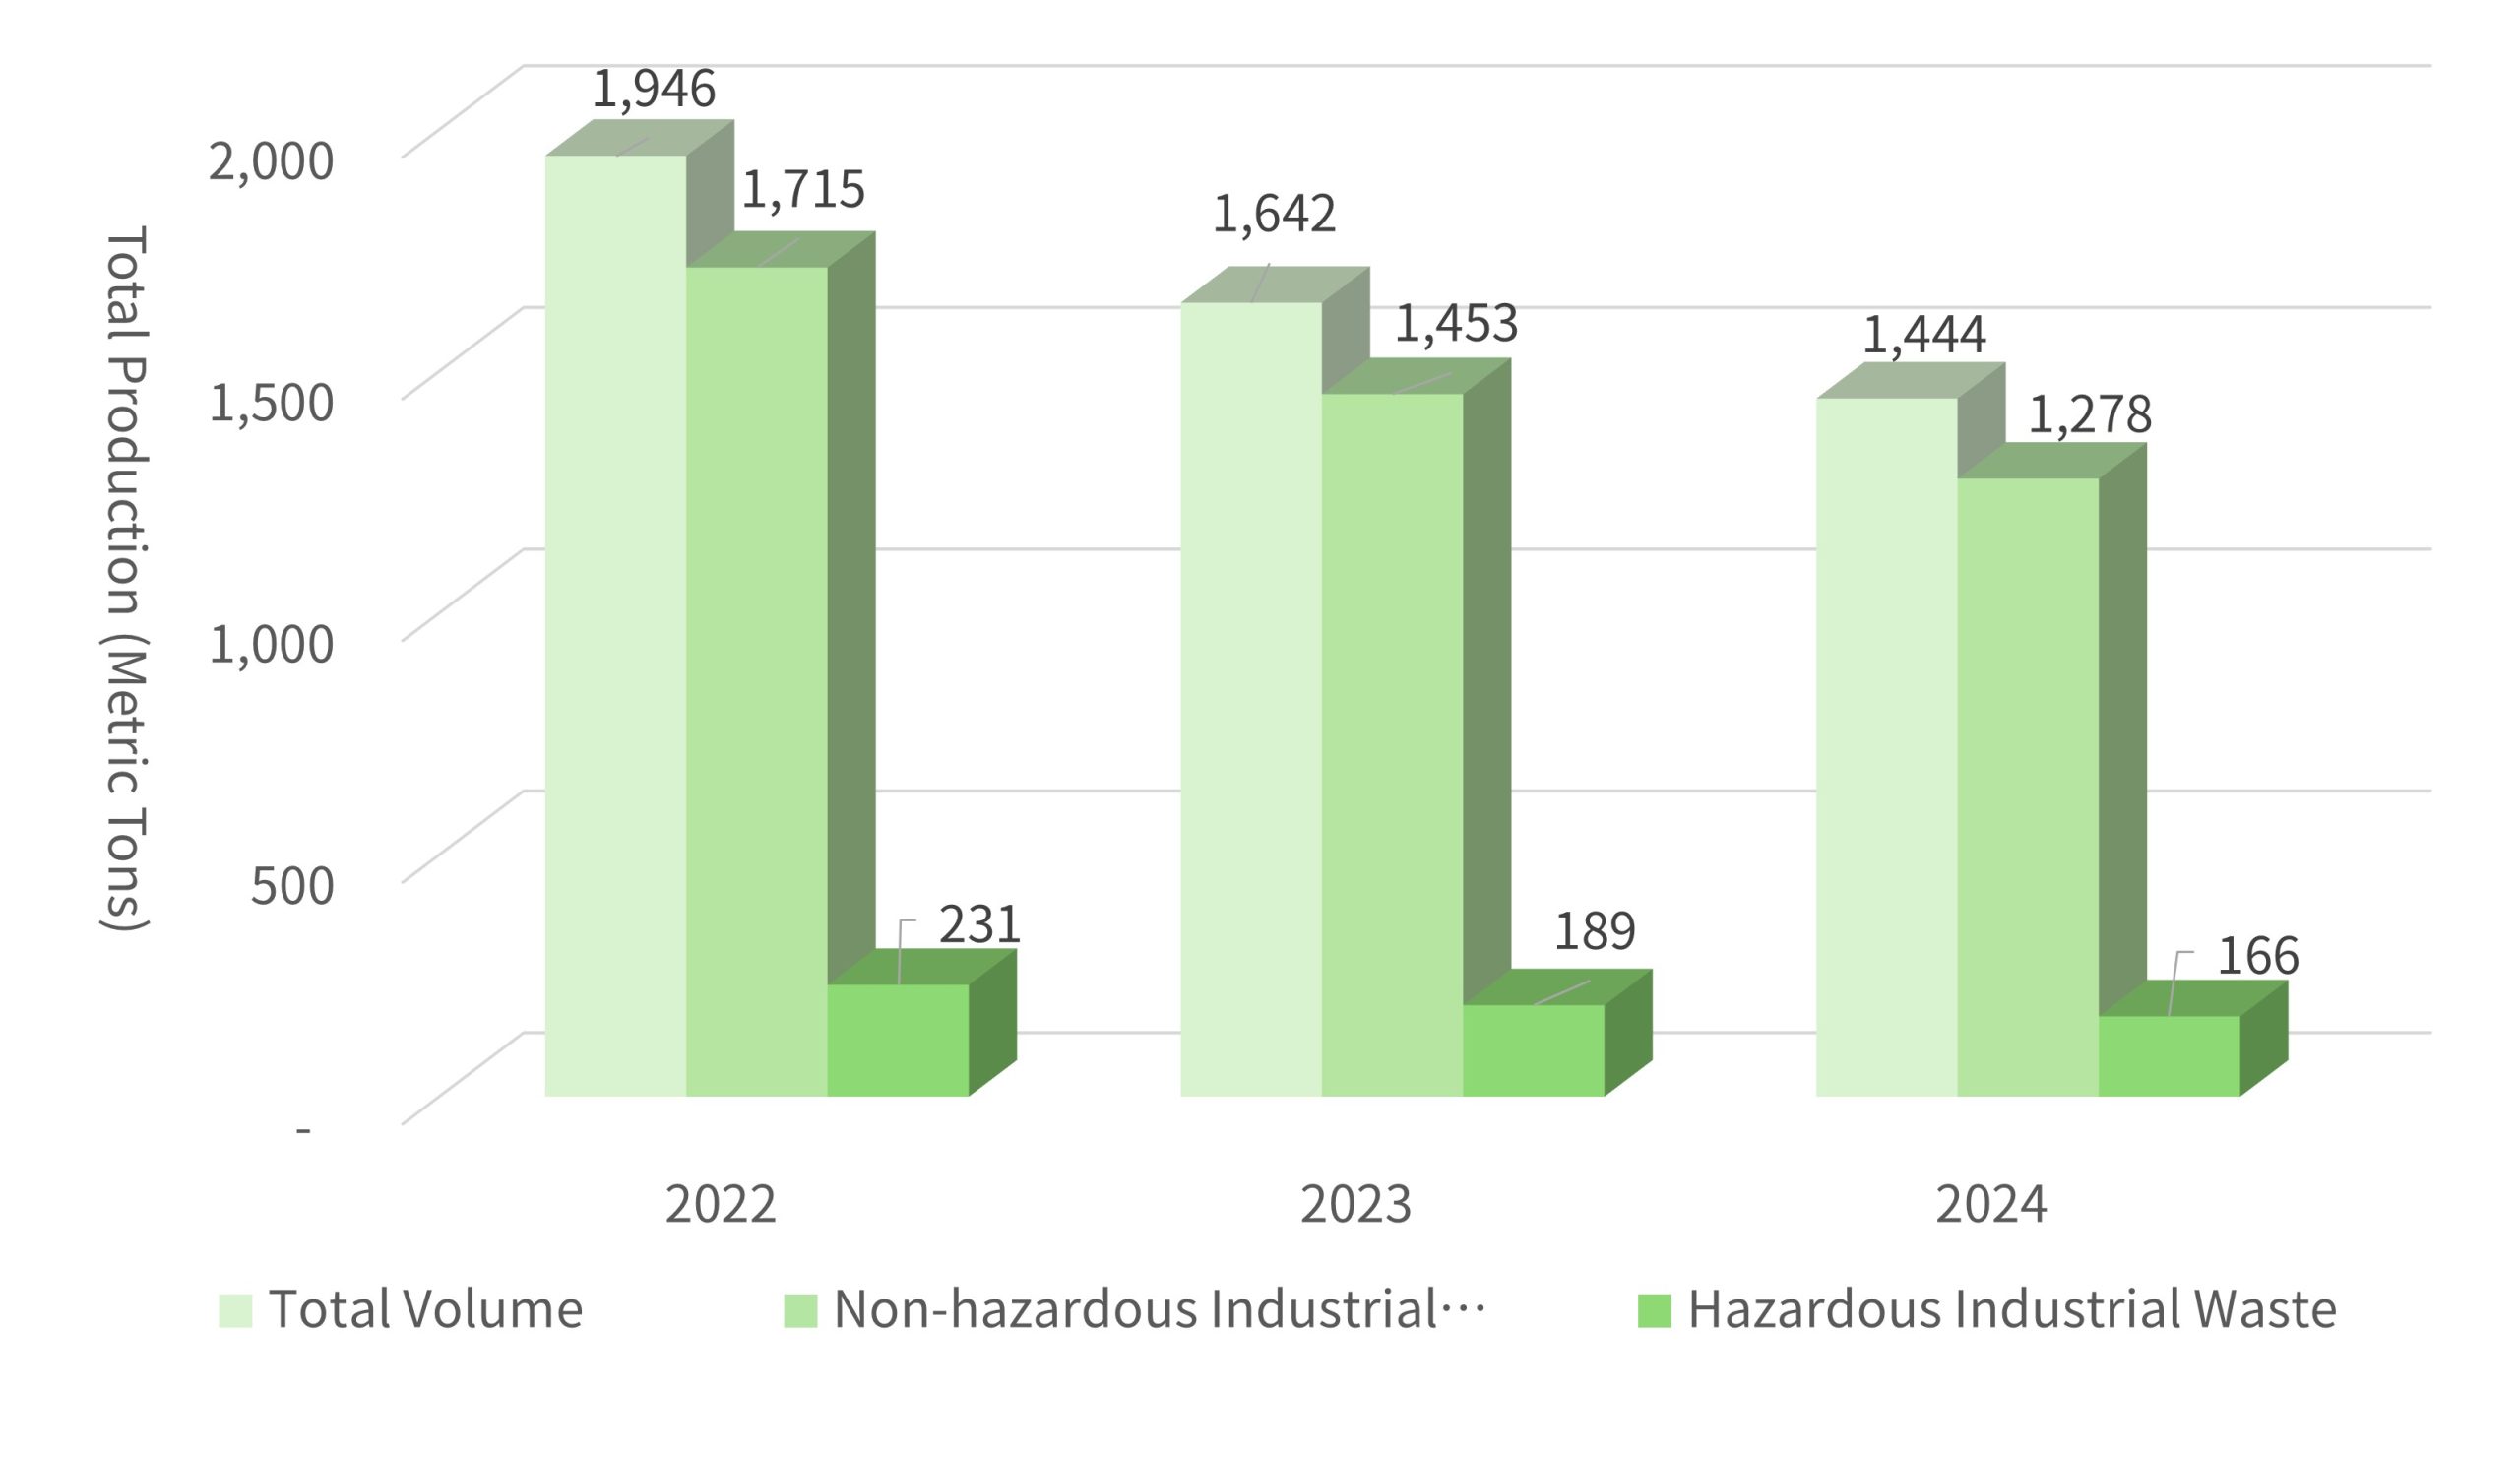
Waste Generation by SiteChung-Hwa Chemical
(Taoyuan Plant No. 1, Taoyuan Plant No. 2, and Changhua Plant)
Taoyuan Plant 1, the Company’s main production facility, accounts for over 95% of the total emissions.

| Year | Waste Output | Hazardous Industrial Waste | General Industrial Waste |
|---|---|---|---|
| 2022 | 1,946 Metric Tons | 231 Metric Tons | 1,715 Metric Tons |
| 2023 | 1,642 Metric Tons | 189 Metric Tons | 1,453 Metric Tons |
| 2024 | 1,444 Metric Tons | 166 Metric Tons | 1,278 Metric Tons |
(The scope of the data includes all operational and office areas across all sites.)
Greenhouse Gas Inventory
Due to the increase in greenhouse gas emissions, climate change not only directly affects the global ecological environment but also indirectly affects the acquisition of energy and resources for enterprises. It has become an environmental issue of global concern and importance. We deeply understand that greenhouse gas reduction is an important means to combat climate change and global warming. Therefore, we identify the sources of greenhouse gas emissions through product carbon footprint inventory, and reduce greenhouse gas emissions through energy-saving and emission reduction methods, thereby enhancing our self-management capabilities. We replace high-energy-consuming process equipment, discuss greenhouse gas reduction plans, set reduction targets and priorities, and implement various carbon reduction plans with the purpose of taking global ecological environment as the Company's responsibility.
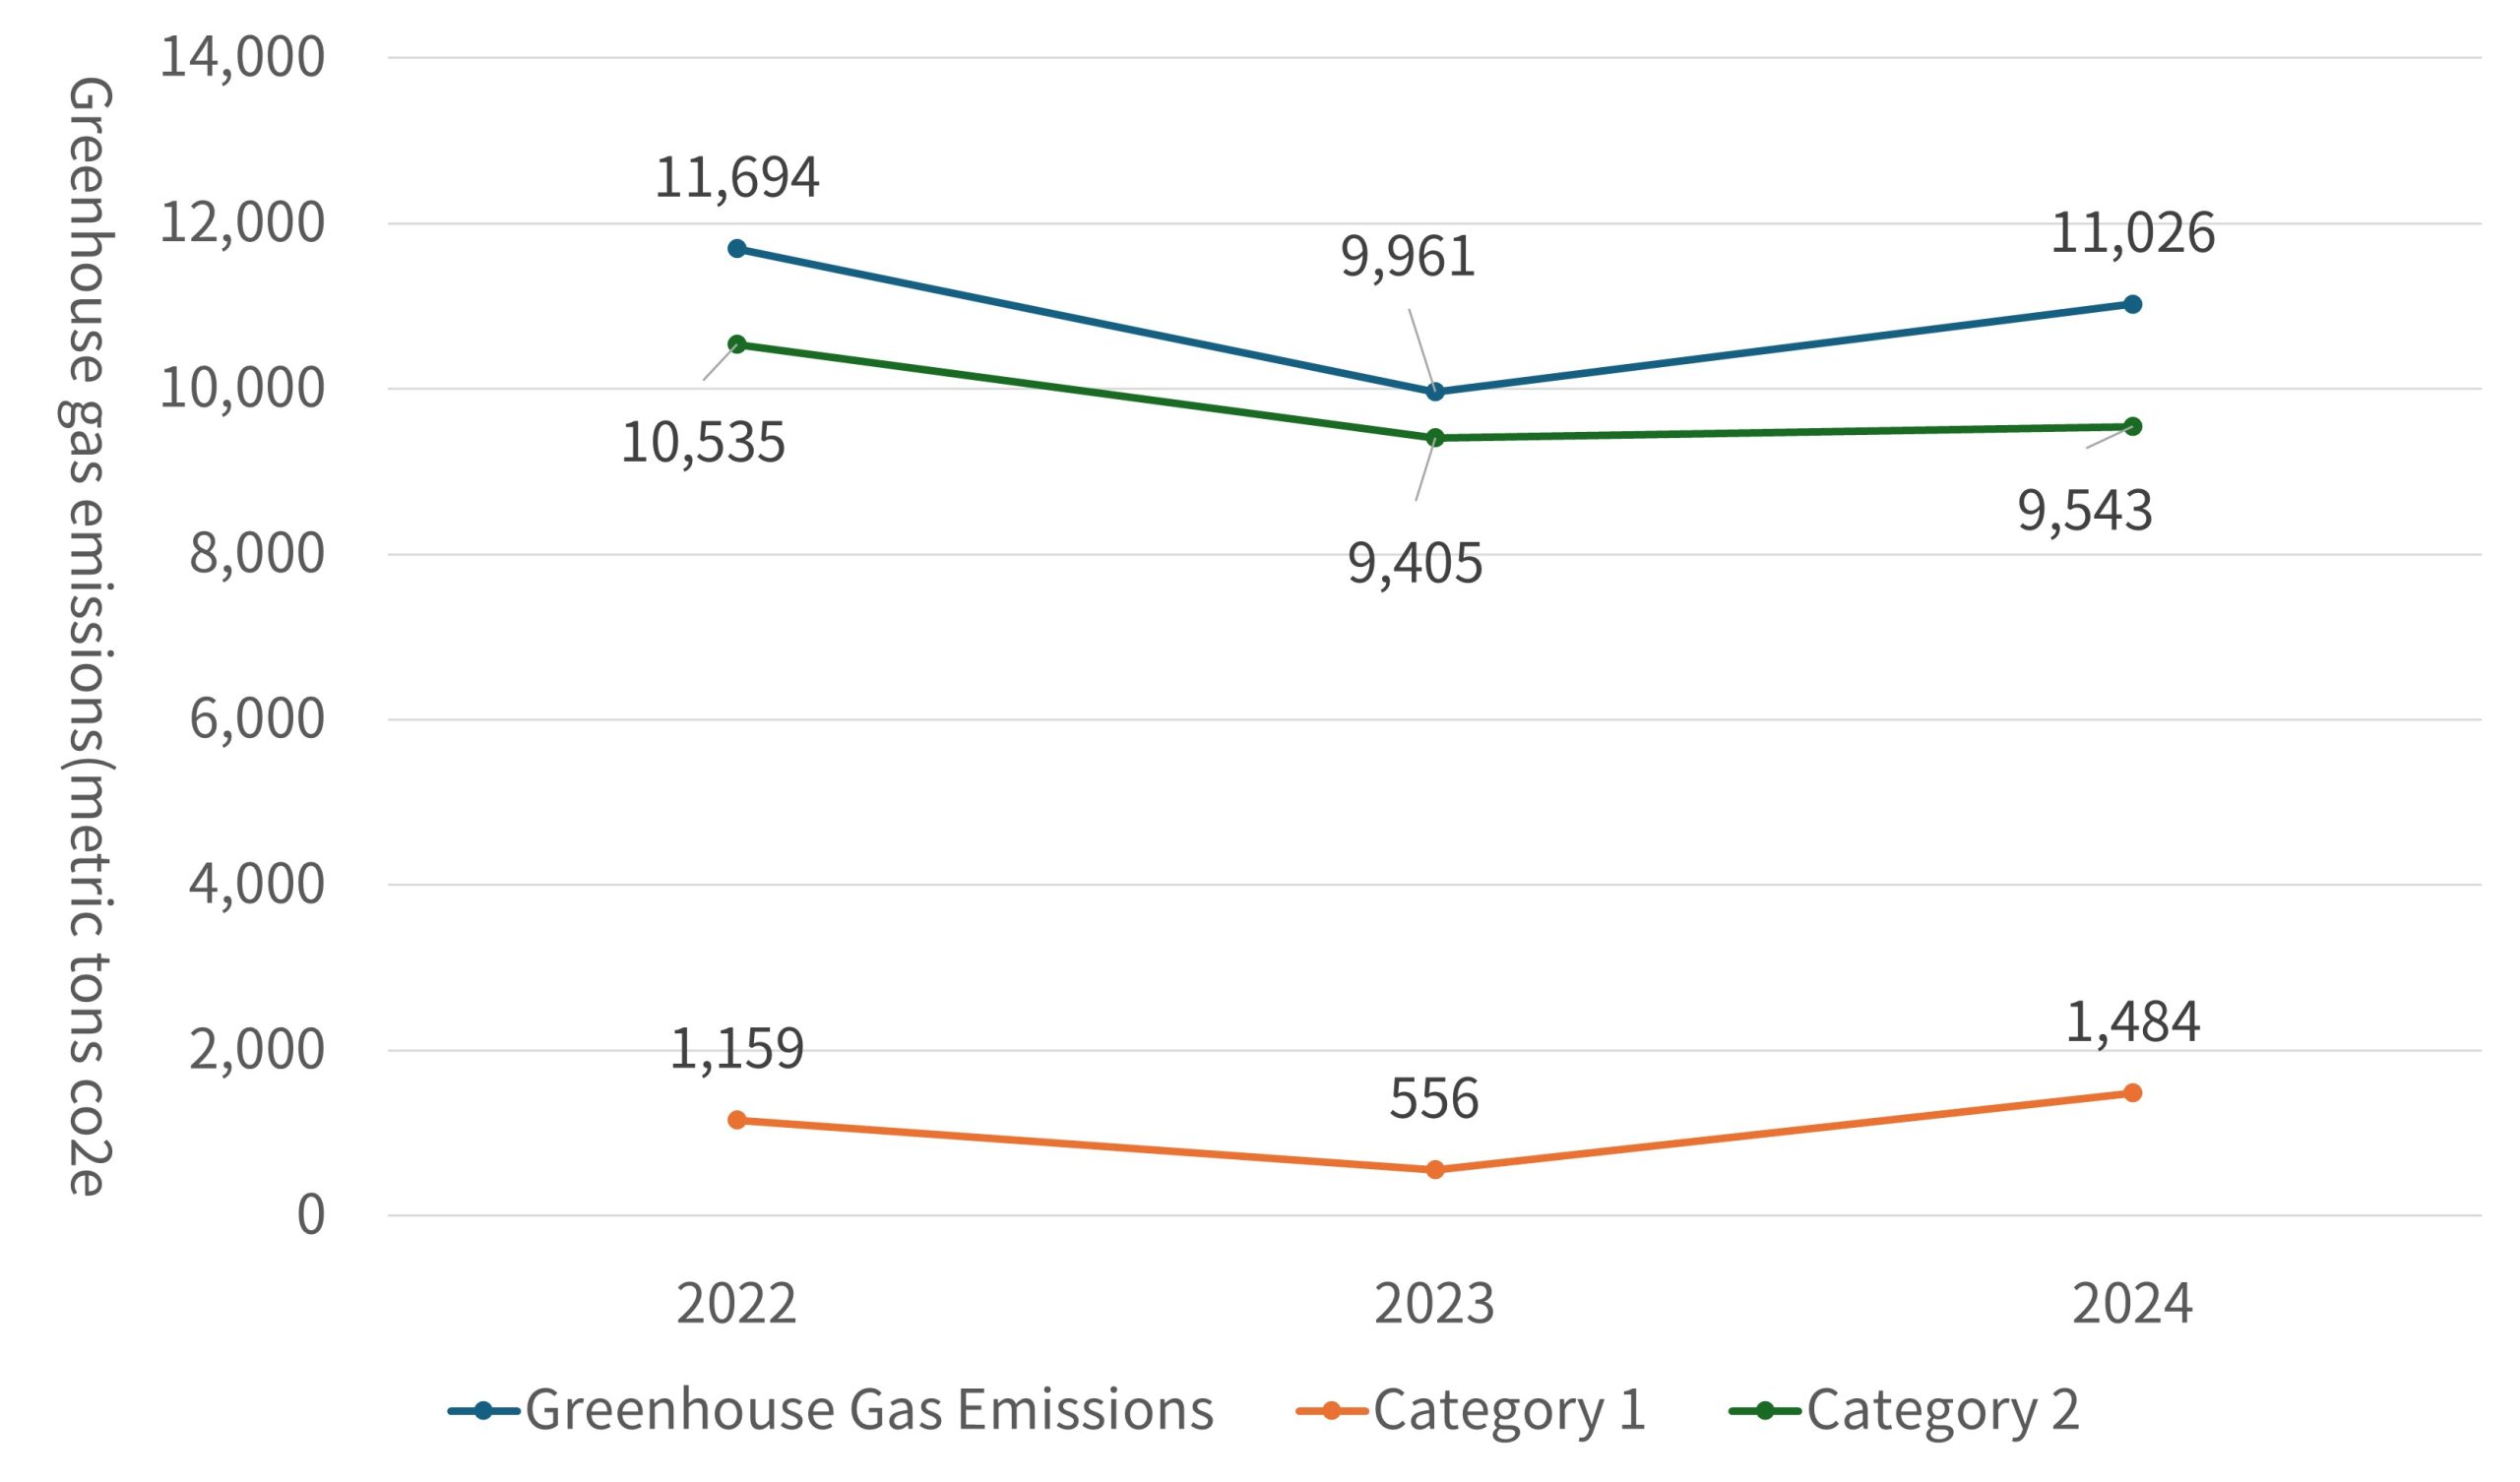
Greenhouse Gas Emissions by Site – Chung-Hwa Chemical
The organizational boundary for emission sources includes Taoyuan Plant 1, Taoyuan Plant 2, and the Changhua Plant.
Taoyuan Plant 1, the Company’s main production facility, accounts for over 95% of the total emissions.

| Year | Greenhouse gas emissions | Scope 1 | Scope 2 |
|---|---|---|---|
| 2022 | 11,694 tCO²e | 1,159 tCO²e | 10,535 tCO²e |
| 2023 | 9,961 tCO²e | 556 tCO²e | 9,405 tCO²e |
| 2024 | 11,026 tCO²e | 1,484 tCO²e | 9,543 tCO²e |
(The scope of the data includes all operational and office areas across all sites.)


